Ground handling market intelligence
Who handles whom at Europe’s airports.
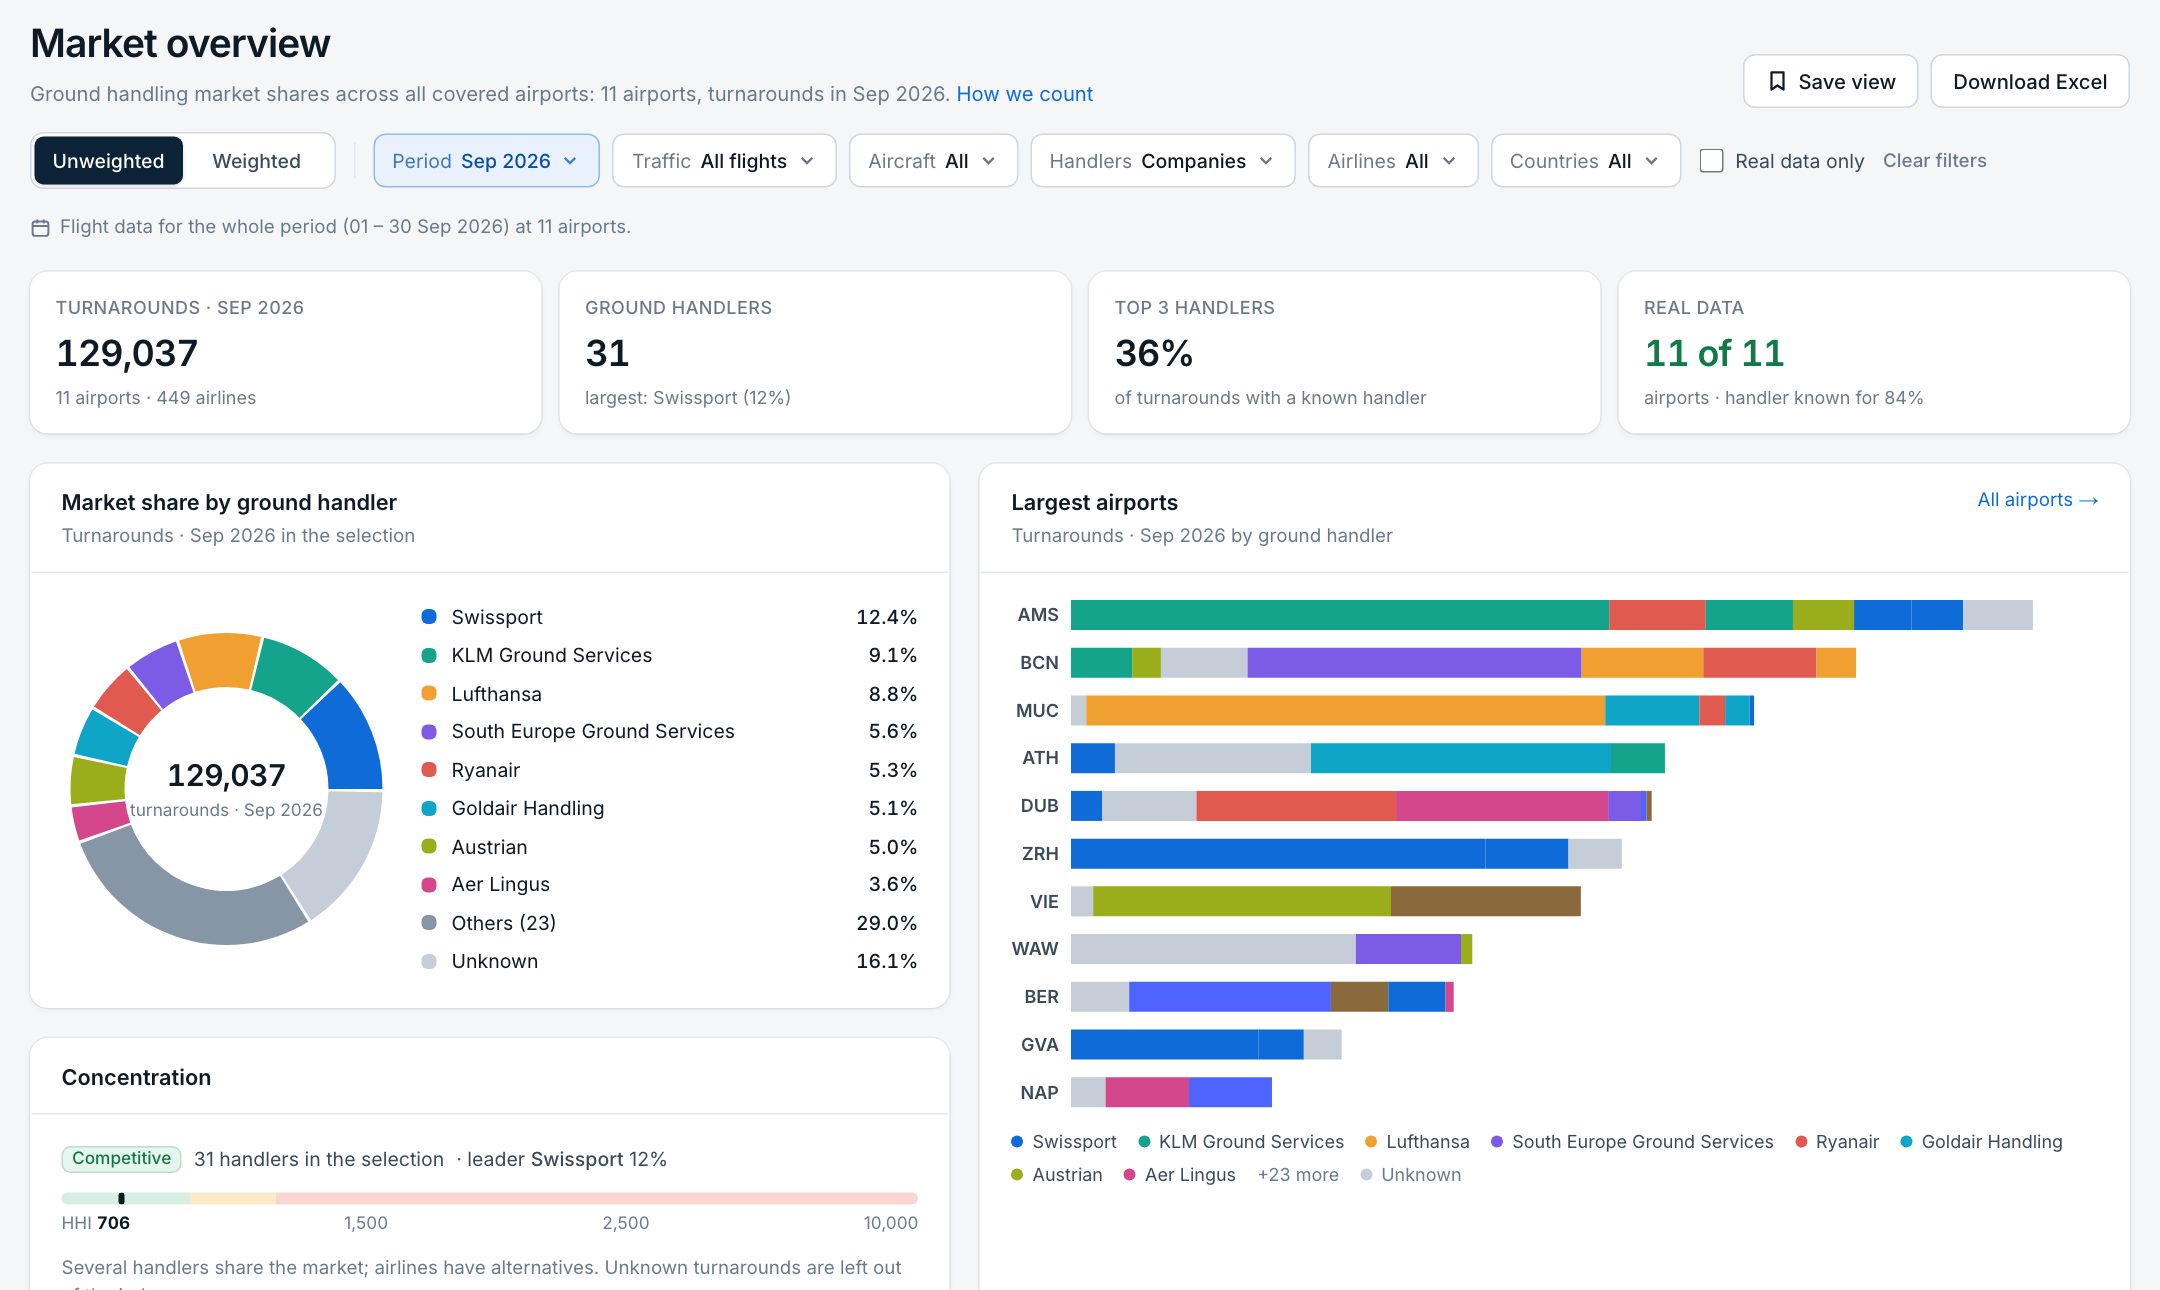
Which airline uses which ground handler at which airport – and how big every handler’s share of the market really is. Built from verified handler assignments and actual departures, airport by airport.
- turnarounds · Sep 2026
- 449,586
- turnarounds · Sep 2026
- airports with actual departures
- 92
- airports with actual departures
- operating airlines
- 896
- operating airlines
- ground handlers
- 105
- ground handlers
Who it’s for
Three questions, one data set
Ground handlers
Where do we stand, where do we grow, whom can we win?
- Market share and rank at every airport
- Expansion targets: airports without you, by size
- Sales leads: airlines you serve elsewhere, handled by a competitor here
Airlines
Who handles us where – and what are the alternatives?
- Your handler per airport with its market share
- How much of the handler’s business you are – your leverage
- Peer benchmark against the airlines you compare yourself with
Consultants & investors
How big is the market and how concentrated?
- Shares per airport, country, region and network
- Concentration (HHI) and the third-party market without self-handling
- Excel exports with filters and period for your own reports
How it works
From handler assignments to market shares
- 1
Who handles whom
For every airport we collect which handler serves which airline, check it automatically and review unclear cases by hand.
- 2
How much is flown
Actual departures per airline and aircraft type, passenger and cargo, month by month – one departure is one turnaround.
- 3
Market shares
Both are matched airline by airline. Shares can be weighted by aircraft size and filtered by period, traffic, fleet, airlines and countries.
Features
Everything a pitch, a tender or a deal needs
Any period
Pick a month, a quarter, an IATA season or any date range – the page always says for which days data exists.
Weighted or not
Count turnarounds 1:1 or weighted by aircraft size: an A380 means more handling work than an A320.
Groups and self-handling
See handlers as companies or as groups, with or without airlines that handle themselves.
Peer benchmark
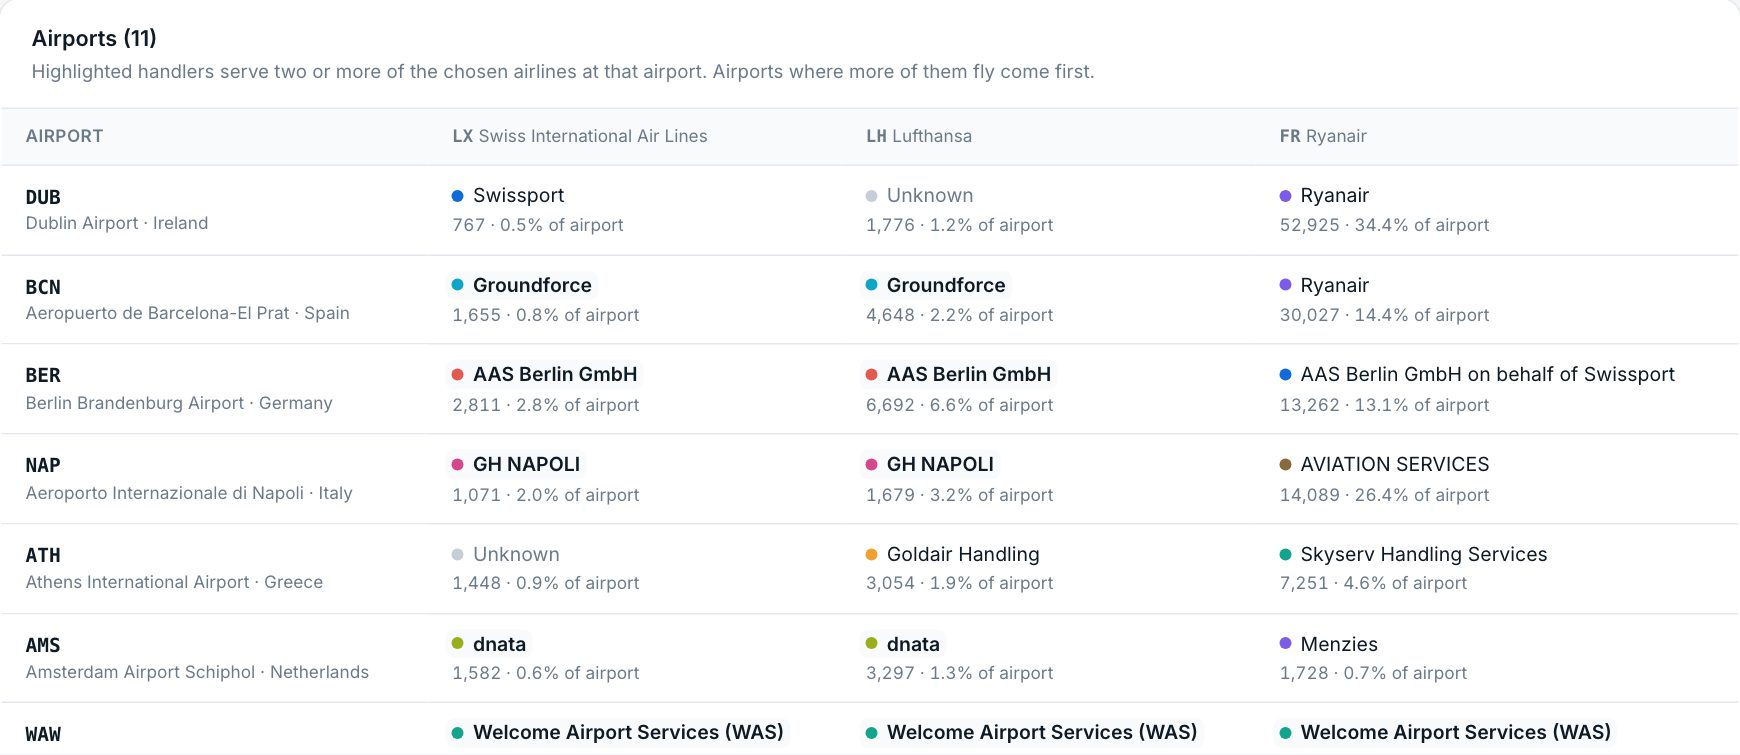
Put airlines side by side: who handles each of them at every airport, and where they share a handler.
Airline groups
See airlines on their own or as groups – Lufthansa Group, IAG, Air France-KLM – with the exact handler mix.
Excel on every page
Every view exports to Excel, with the filters and the period on the first sheet.
Compare airlines in one view
Choose your airline and its peers. The matrix shows each one’s handler, volume and share at every airport – the starting point for a tender or a renegotiation.
See your market the way it really is.
Create an account; we activate it after a short check.